Accessing data on DCOR
General remarks
There are two ways of interacting with data on a DCOR instance, via the web interface or via the API. With the web interface (not covererd here), you can browse and search data in a convenient way with your webbrowser. The API allows you to write custom scripts or libraries (DCOR-Aid uses the API).
Note that there are two main DCOR instances. One for development and
testing ( DCOR-dev) and one for
production use (
DCOR-dev) and one for
production use ( DCOR). If you
are new to DCOR, please use the DCOR-dev instance to get to know the system.
If you are ready to get serious, move on to the production instance.
DCOR). If you
are new to DCOR, please use the DCOR-dev instance to get to know the system.
If you are ready to get serious, move on to the production instance.
Access via DCOR-Aid GUI
It is possible to access all data on DCOR via your browser by visiting https://dcor.mpl.mpg.de. However, you might want to consider using DCOR-Aid instead, because:
You can more easily browse circles and collection in the DCOR-Aid GUI.
You can drag and drop resources from DCOR-Aid into DCscope (no need to copy and paste resource IDs).
DCOR-Aid comes with a resource download manager.

Fig. 1 The DCOR-Aid setup wizard guides you through the initial setup.
If you installed DCOR-Aid for the first time, the setup wizard will ask you to choose how you would like to use DCOR-Aid. If you are only interested in public data, then choose the Anonymous option.
When DCOR-Aid starts, you will then see several tabs. The tab on the right Find Data allows you to search the DCOR database for datasets and resources. If you previously entered an API token, then you can also browse all your datasets in the My Data tab.
To search for a particular dataset, simply type your search term in the search field. If you are interested in more elaborate search options, please create an issue at the DCOR-Aid issue page.
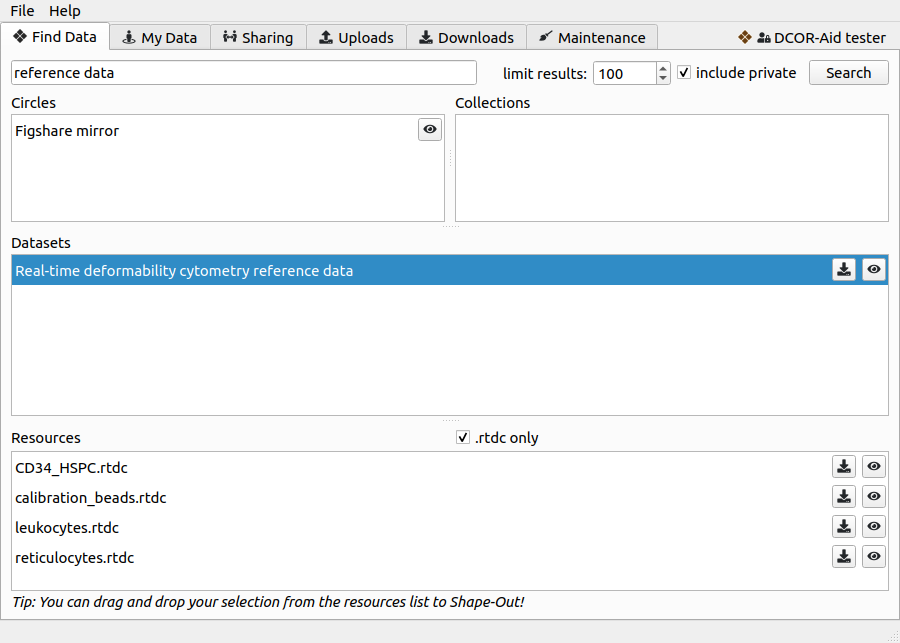
Fig. 2 The search results in the Find Data tab can be filtered by circle and collection. The tool buttons allow you to download datasets and resources and to view them online.
Access via DCOR-Aid Python library
The DCOR-Aid Python library provides you with a convenient interface to the API. In principle, you are not limited to Python or DCOR-Aid, as DCOR is basically CKAN and thus uses the same API.
To initiate a connection with DCOR, run:
In [1]: import dcoraid

In [2]: api = dcoraid.CKANAPI(server="dcor-dev.mpl.mpg.de",
   ...:                       api_key="eyJ0eXAiOiJKV1QiLCJhbGciOiJIUzI1NiJ9.eyJqdGkiOiItNUVsLVBTZVdfZ3hMM2tKNnZXS0hWZUdsN011SnpMRlFRMHluNzdUanZqRnhLX3VNLTQyUHhsbVQwRl9yOGlZbklOam9CN3E4emZITDA0TCIsImlhdCI6MTYzNDY1NTc1OH0.VfHEPXdEZKjCZOP4bO8cl0OiIxsvZZksWyQLl80UGbI")
   ...:

# check that everything works
In [3]: assert api.is_available()
Here, server is the DCOR instance you are connecting to and
api_key is your personal access token that you need if you would like
to access private data. You can omit api_key if you are only interested
in public data (or if you don’t have an account).
The dcoraid.CKANAPI class gives you full access to the underlying
API. For instance, you could
list all details of
this dataset with:
In [4]: dataset_dict = api.get("package_show", id="figshare-7771184-v2")

# the first ten entries of the dataset dictionary
In [5]: for key in list(dataset_dict.keys())[:10]:
   ...:     print(f"{key:18s}: {dataset_dict[key]}")
   ...:
authors           : Philipp Rosendahl, Christoph Herold, Paul Müller, Jochen Guck
creator_user_id   : 60a214ed-a079-4334-b277-7b64c40ae675
doi               : 10.6084/m9.figshare.7771184.v2
id                : 89bf2177-ffeb-9893-83cc-b619fc2f6663
isopen            : True
license_id        : CC0-1.0
license_title     : Creative Commons Public Domain Dedication
license_url       : https://creativecommons.org/publicdomain/zero/1.0/
metadata_created  : 2025-09-28T03:10:27.497301
metadata_modified : 2025-10-01T15:44:57.986689

# all resource names in the dataset
In [6]: print([r["name"] for r in dataset_dict["resources"]])
['CD34_HSPC.rtdc', 'calibration_beads.rtdc', 'README.txt', 'leukocytes.rtdc', 'reticulocytes.rtdc']

# the first ten metadata entries of the first resource
In [7]: for key in list(dataset_dict["resources"][0].keys())[:10]:
   ...:     print(f"{key:31s}: {dataset_dict['resources'][0][key]}")
   ...:
cache_last_updated             : None
cache_url                      : None
created                        : 2025-09-28T03:10:28.009217
dc:experiment:date             : 2017-02-09
dc:experiment:event count      : 112000
dc:experiment:run index        : 1
dc:experiment:sample           : HSC_apher_raw_APC
dc:experiment:time             : 15:13:04
dc:fluorescence:bit depth      : 16
dc:fluorescence:channel 3 name : 700/75
Note
Beware of the dataset ambiguity: On DCOR, a dataset (or package)
contains a number of resources. You would call one of those resources
a dataset in dclab. In other words, on DCOR a dataset consists of multiple
DC files while with dclab.new_dataset() you always ever only open
one resource.
Another very useful tool in DCOR-Aid is the APIInterrogator class
which sits on top of CKANAPI and, amongst other things, simplifies
searching for datasets:
# instantiate APIInterrogator
In [8]: air = dcoraid.APIInterrogator(api)

# search for a dataset in a DCOR circle
In [9]: dbe = air.search_dataset_via_api(query="reference data",
   ...:                                  circles=["figshare-import"])
   ...:

# the returned database extract (one hit)...
In [10]: len(dbe)
Out[10]: 4

# ...contains all metadata of the datasets matching the search query
In [11]: dbe[0]["name"]
Out[11]: 'figshare-12721436-v1'
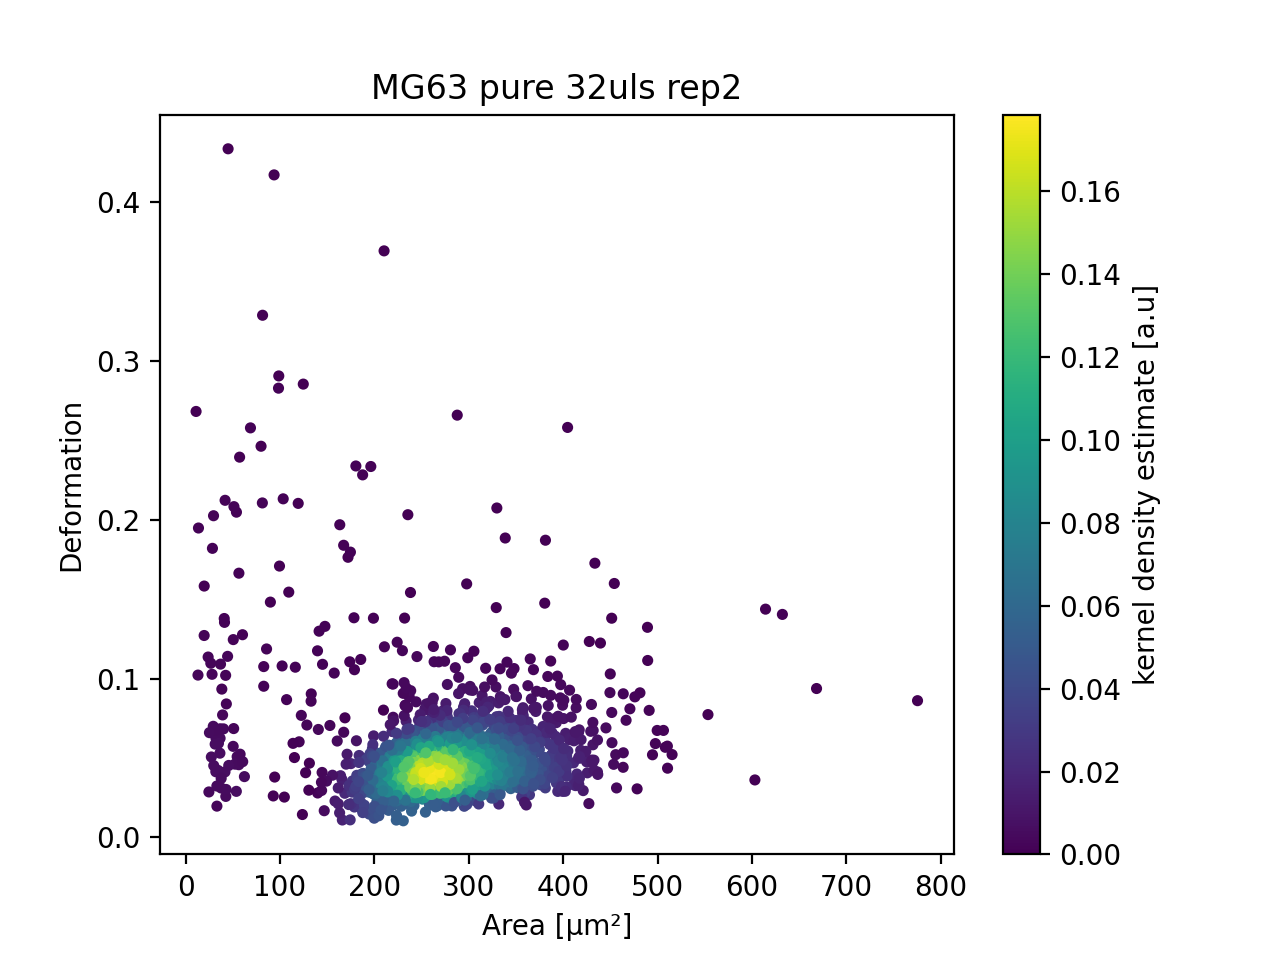
Example: List all DC resources for a DCOR circle
Let’s say you are interested in all DC data files in a DCOR circle,
because you would like to run an automated analysis with dclab.
The following script creates a list of IDs resource_ids with all DC
files in the
Figshare mirror
circle and plots one of the resources. For more information on how to
access DCOR data with dclab, please refer to the
dclab docs.
import dclab
import dcoraid
import matplotlib.pylab as plt

# name of the circle in question
circle_name = "figshare-import"

# initialize API (for private datasets, also provide `api_key`)
api = dcoraid.CKANAPI("dcor.mpl.mpg.de")
air = dcoraid.APIInterrogator(api)
# get a list of all datasets for `circle_name`
datasets = air.search_dataset_via_api(circles=[circle_name], limit=0)
# iterate over all datasets and populate our resources list
resource_ids = []
for ds_dict in datasets:
    # iterate over all resources of a dataset
    for res_dict in ds_dict["resources"]:
        # identify DC data
        if res_dict["mimetype"] == "RT-DC":
            resource_ids.append(res_dict["id"])

# do something with one of the resources in dclab
with dclab.new_dataset(resource_ids[47]) as ds:
    kde = ds.get_kde_scatter(xax="area_um", yax="deform")
    ax = plt.subplot(111, title=ds.config['experiment']['sample'])
    sc = ax.scatter(ds["area_um"], ds["deform"], c=kde, marker=".")
    ax.set_xlabel(dclab.dfn.get_feature_label("area_um"))
    ax.set_ylabel(dclab.dfn.get_feature_label("deform"))
    plt.colorbar(sc, label="kernel density estimate [a.u]")
    plt.show()
(Source code, png, hires.png, pdf)

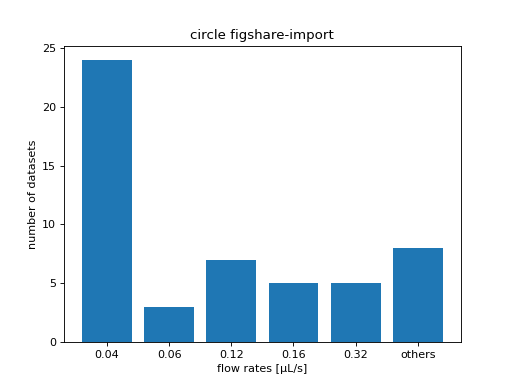
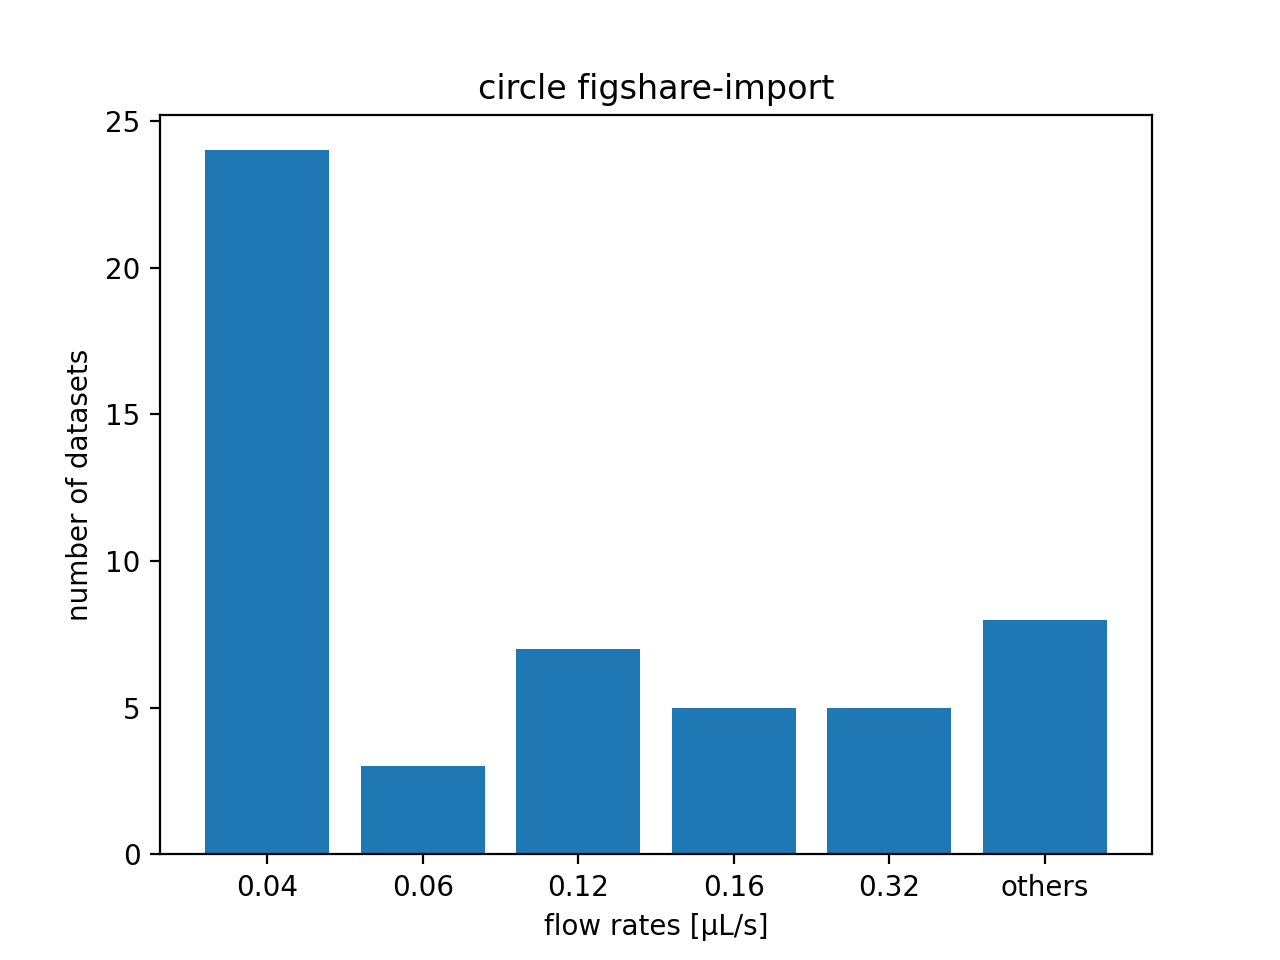
Example: Order all resources of a DCOR circle according to flow rate
You may need to order your resources according to a certain metadata key. You can find all available metadata keys in the resource view in the DCOR web interface (scroll all the way down and click “show more”). In this example, we order all resources according to flow rate (the “dc:setup:flow rate” resource key).
import dclab
import dcoraid
import matplotlib.pylab as plt
import numpy as np

# name of the circle in question
circle_name = "figshare-import"

# dictionary with flow rates of interest
flow_rate_ids = {
    0.04: [],
    0.06: [],
    0.12: [],
    0.16: [],
    0.32: [],
    }

# list of flow rates that don't fit into the above dictionary
unsrt_ids = []

# initialize API (for private datasets, also provide `api_key`)
api = dcoraid.CKANAPI("dcor.mpl.mpg.de")
air = dcoraid.APIInterrogator(api)
# get a list of all datasets for `circle_name`
datasets = air.search_dataset_via_api(circles=[circle_name], limit=0)
# iterate over all datasets
for ds_dict in datasets:
    # iterate over all resources of a dataset
    for res_dict in ds_dict["resources"]:
        # identify DC data
        if res_dict["mimetype"] == "RT-DC":
            flow_rate = res_dict.get("dc:setup:flow rate", np.nan)
            for fr in flow_rate_ids:
                if np.allclose(flow_rate, fr):
                    flow_rate_ids[fr].append(res_dict["id"])
                    break
            else:
                unsrt_ids.append((flow_rate, res_dict["id"]))

# plot some statistics
ax = plt.subplot(title=f"circle {circle_name}")
plt.bar([f"{fr}" for fr in flow_rate_ids] + ["others"],
        [len(flow_rate_ids[fr]) for fr in flow_rate_ids] + [len(unsrt_ids)])
ax.set_xlabel("flow rates [µL/s]")
ax.set_ylabel("number of datasets")
plt.show()
(Source code, png, hires.png, pdf)